


StreetLight Data Historical Travel Visualizer
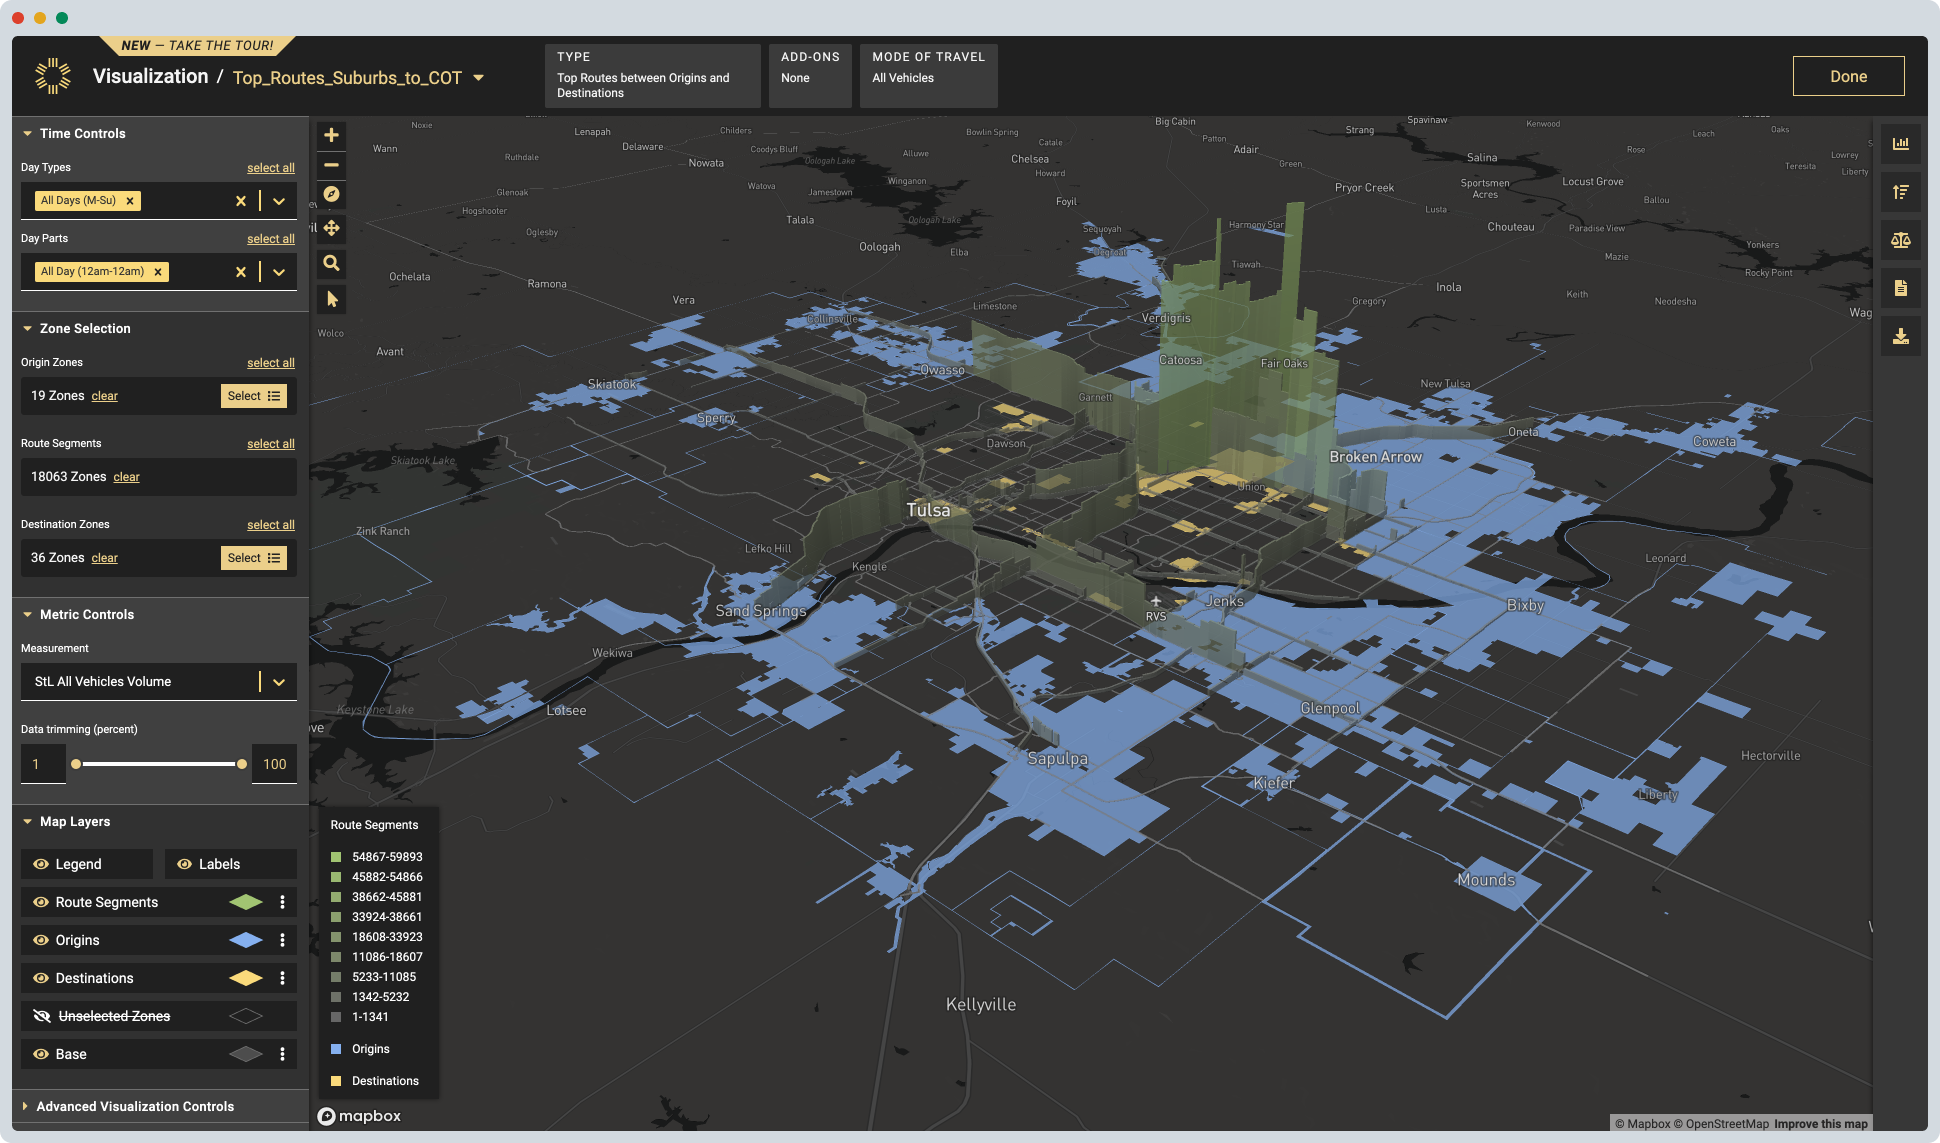
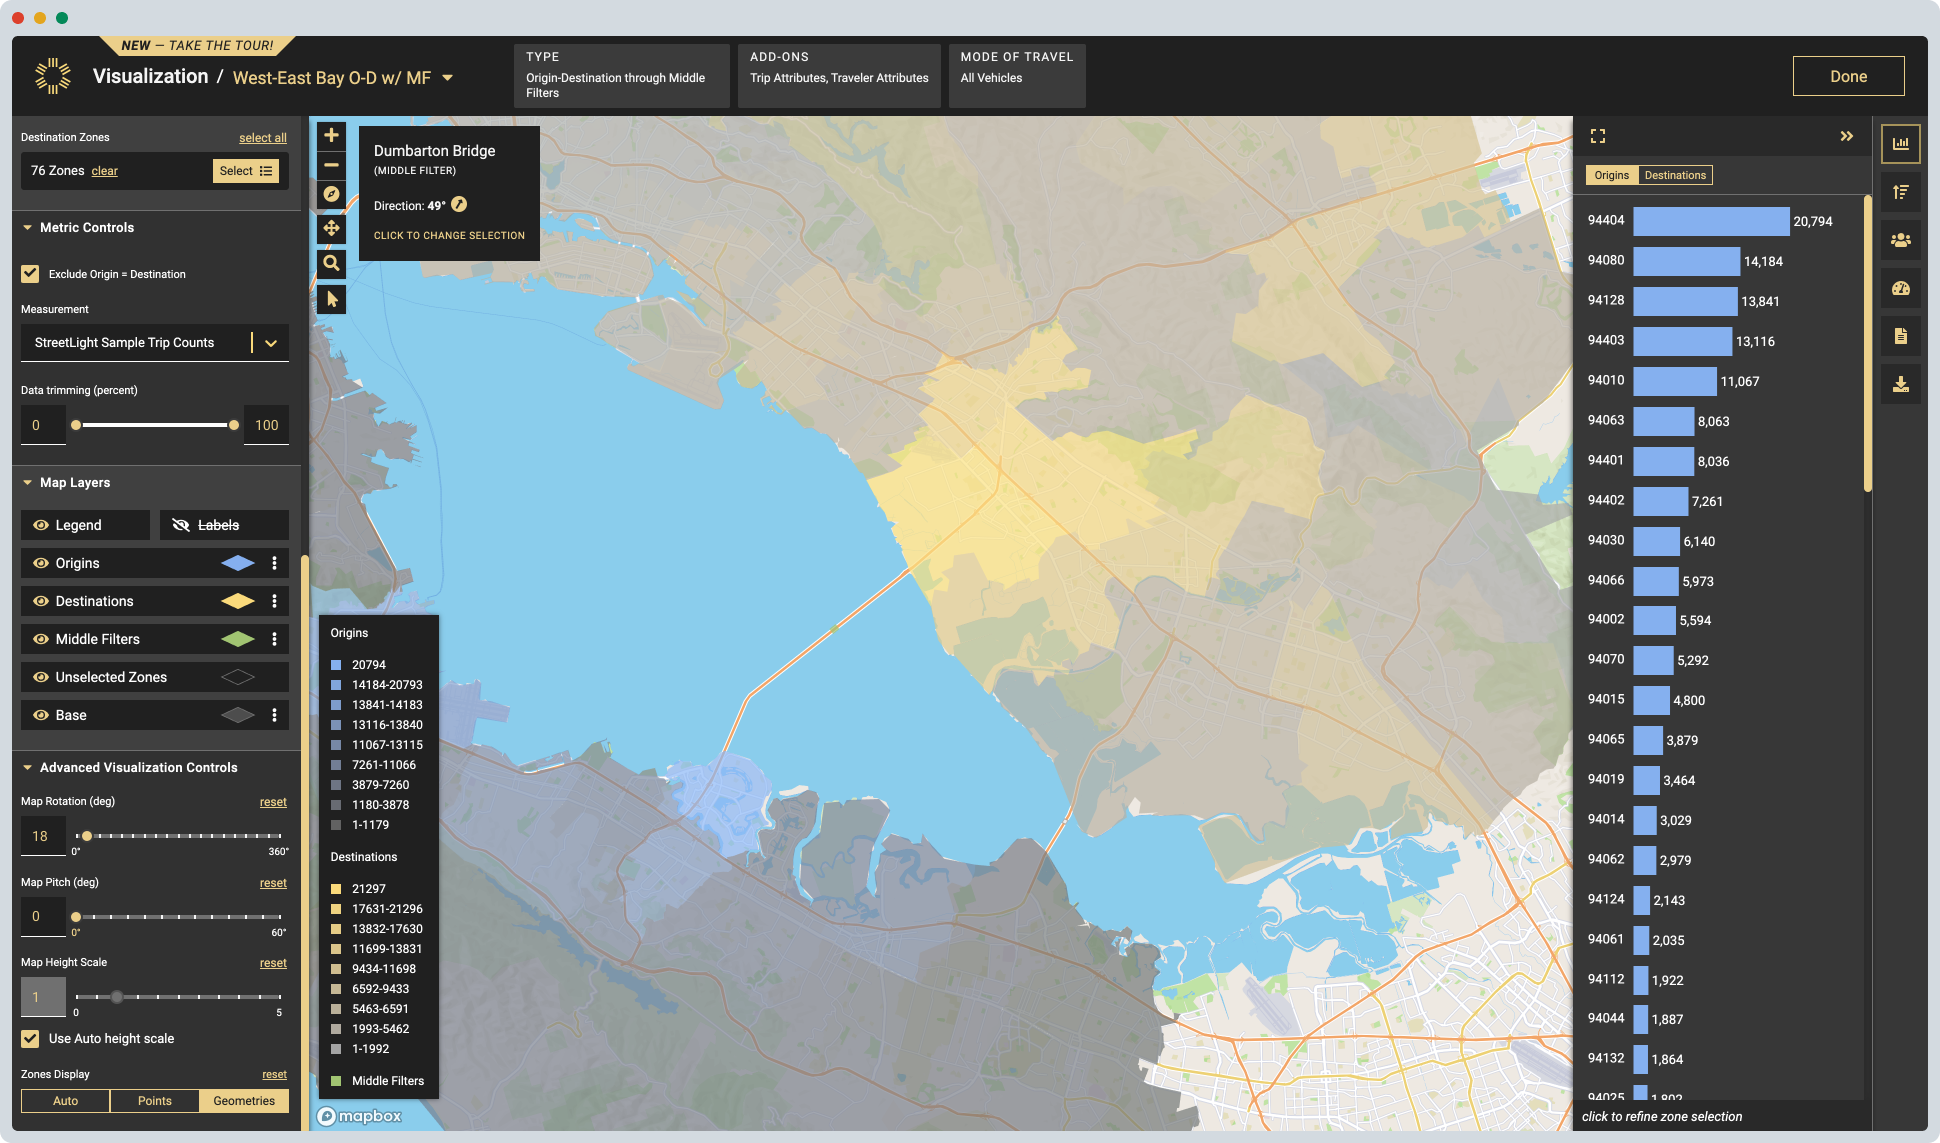
While at StreetLight Data, I led a project to build a bespoke travel metric visualization experience which removed our dependency on a third-party embedded visualization technology and delivered a differentiated historical travel comparison experience to market.
I interviewed users to identify gaps in the existing embedded visualization tool, performed extensive competitive research across different map-based visualization tools and technologies, and partnered with engineering to pull together the right technology to drive a best-in-class experience.
The new visualization experience included innovative interactive patterns for geospatial exploration, including the ability for users to simply select geometries on a map and show origin and destination metrics in a single click, which made it possible to use data for detailed transportation planning decisions without having to upload metrics into a separate GIS tool.